
Dashboard
| Interfaces > Status > Dashboard |
SoftwareCentral dashboard is an interface where a graphical representation of some data can be seen, to easy get an overview on how a specific status is, there is over 20 different types of graphs that can be added, and each have a detailed view where data for the element can be exported as a CSV file for further investigation.
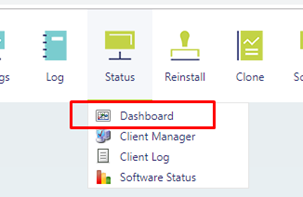
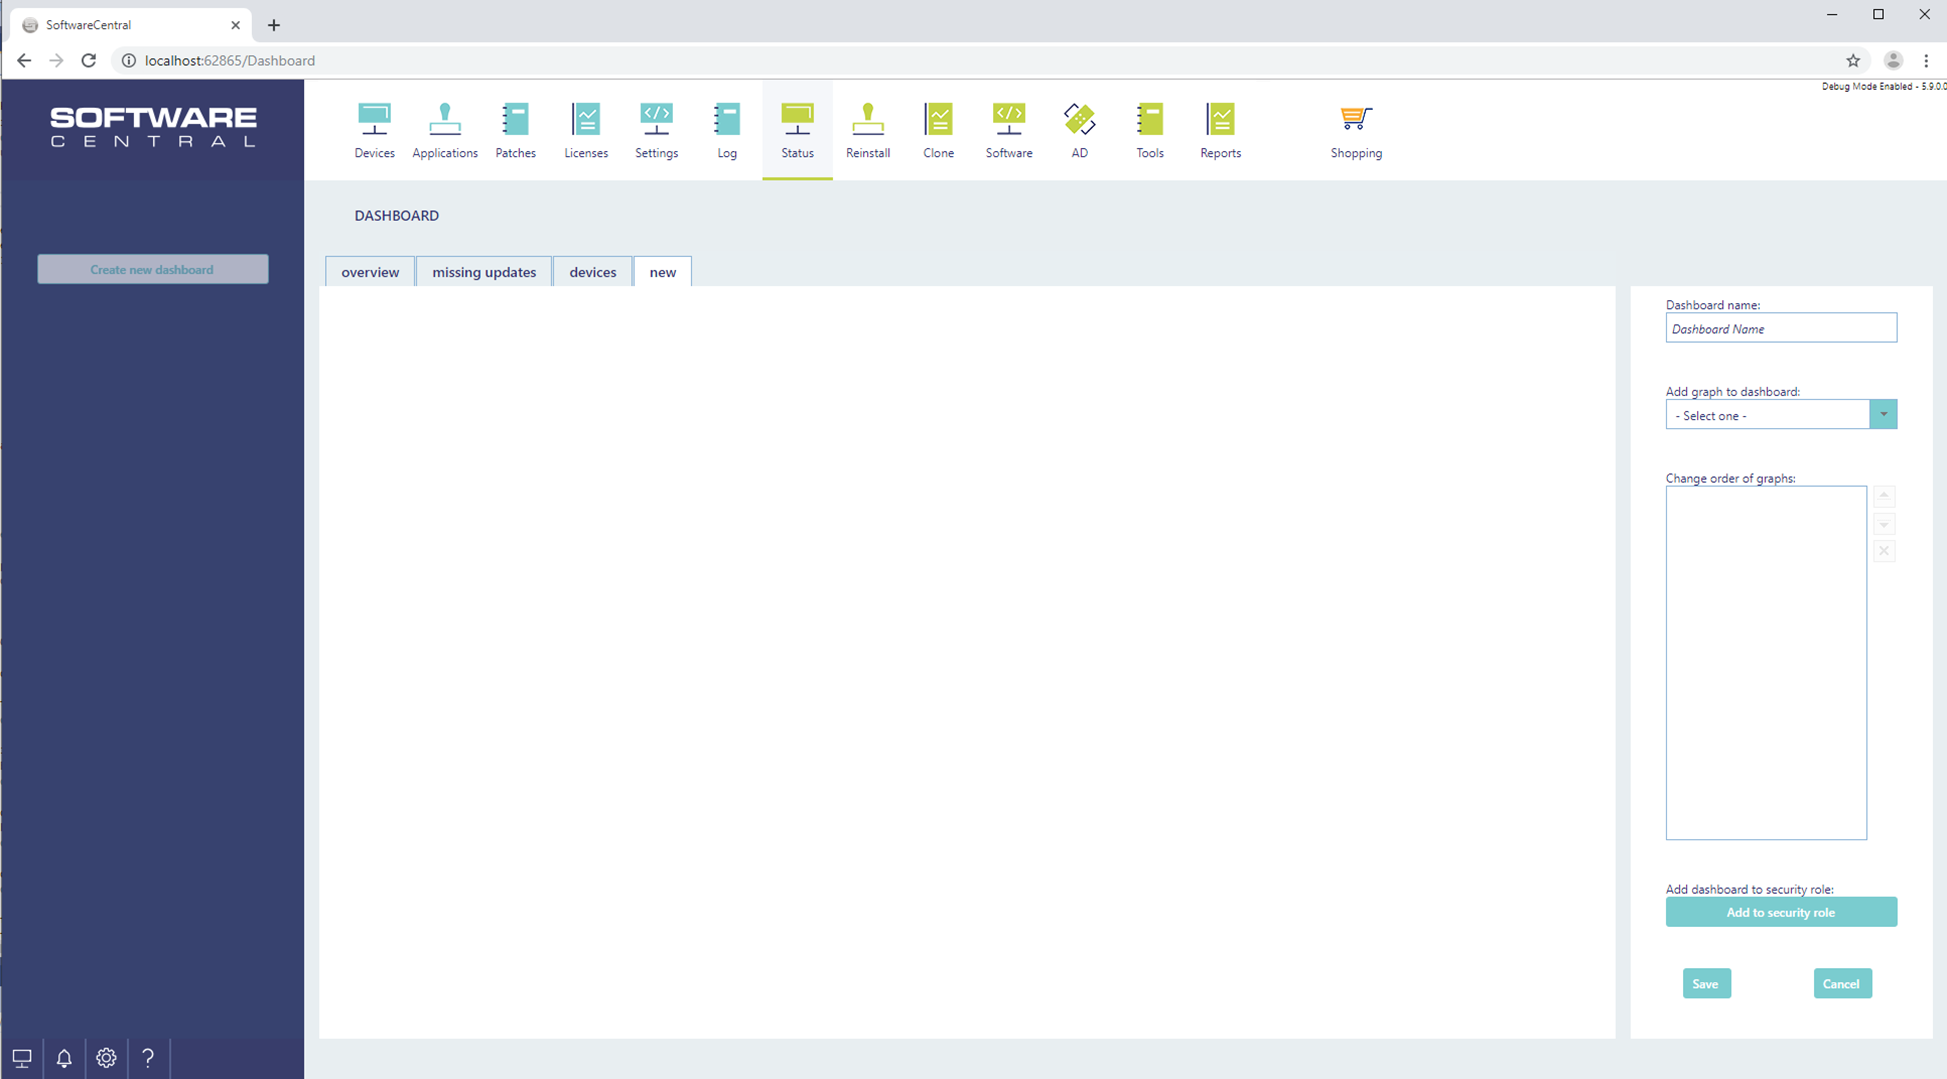
The interface is found under the status button and the Dashboard:
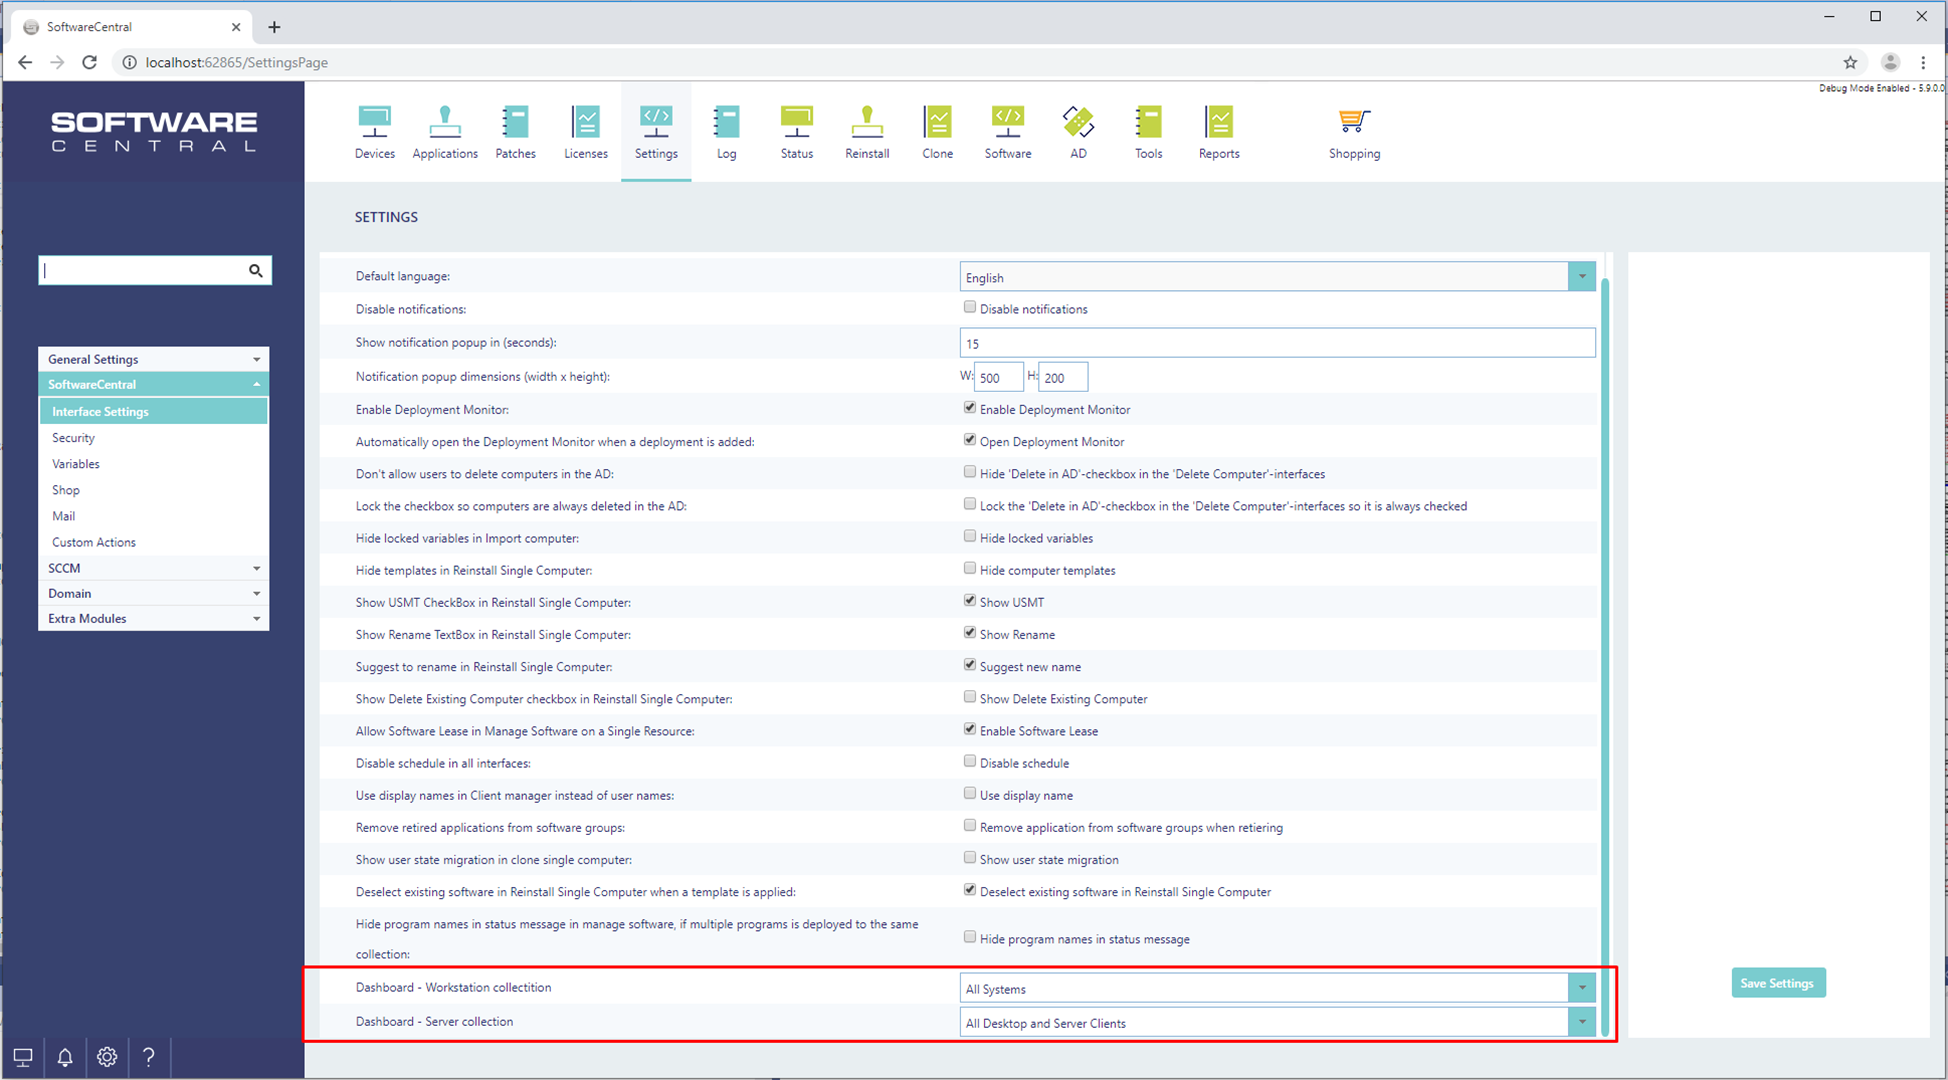
Before going to the interface, make sure that the following two setting is selected in the SoftwareCentral setting menu, these settings are used in multiple graphs. The settings are found under “Interface settings”:
The interface has three buttons for each of the three operation, create, edit and delete. These operations can be delegated to a security role, via the menu button setting, so only specific roles can make changes to the dashboard.
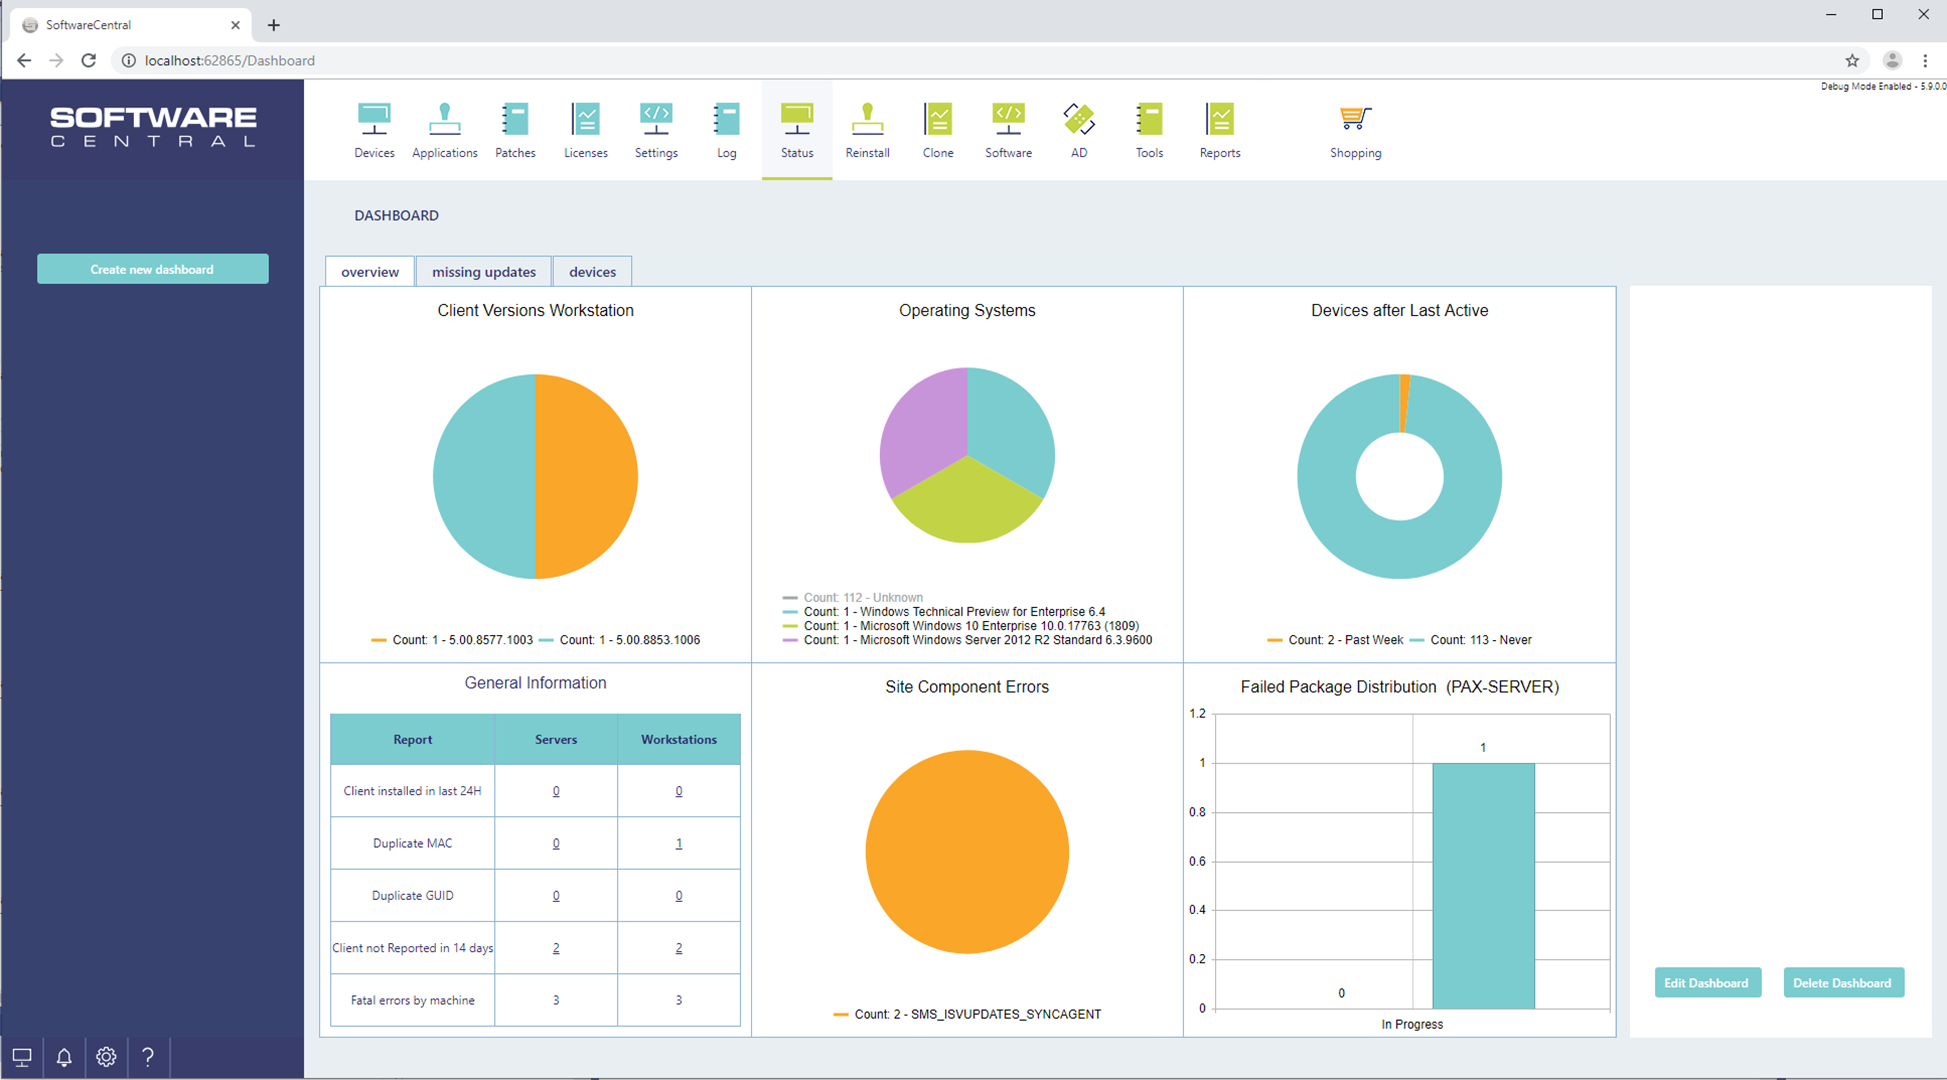
Each dashboard can contain a maximum of 6 data representations, and the dashboard will automatically adapt to both the amount of data representation, but also the size of the browser window.
To change dashboard, simple click on the desired dashboard name in the tab menu and the information for the dashboard is loaded.
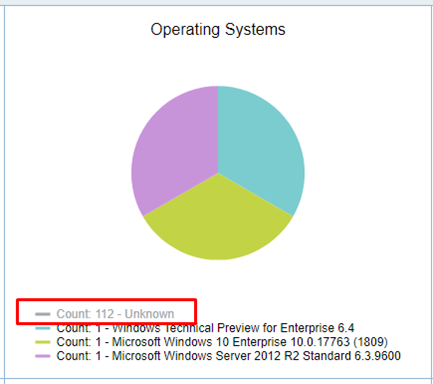
In the legend description of a graph the different label descriptions can be clicked to hide the data in the graph. This can be use if there is one or more data points containing most of the data.
Each part of a graph or each row in a grid can be clicked on to open a new window with more detailed information about the specific data.
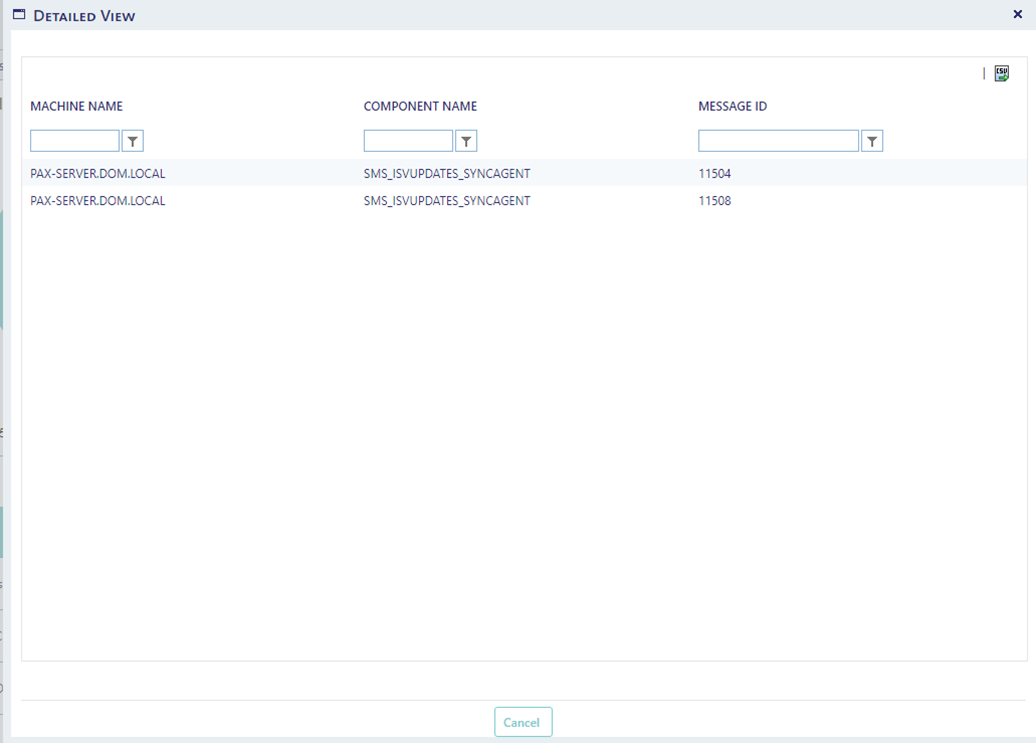
The data in the window can be exported to a csv file.
To create a new dashboard, the “Add new dashboard” button is clicked. This will add a new tab in the tab menu and will open the settings panel in the right side of the menu.
Here a name is added to the dashboard in the top of the right menu.
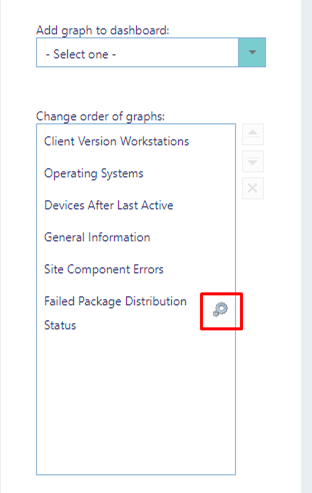
Next the different types of graphs or grids are selected in the drop-down menu. When an item is selected it will automatically be added to the list of items in the dashboard.
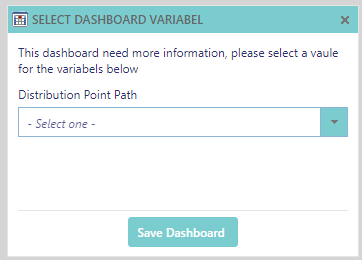
Some dashboard needs additional information before it can be added to a dashboard, when this is the case a small window will open where the dashboard variable value is selected, and “Save Dashboard” is pressed to add the item.
A variable can be changed again by pressing the small well in the list of items in the dashboard, this will open the variable window again and another variable can be selected.
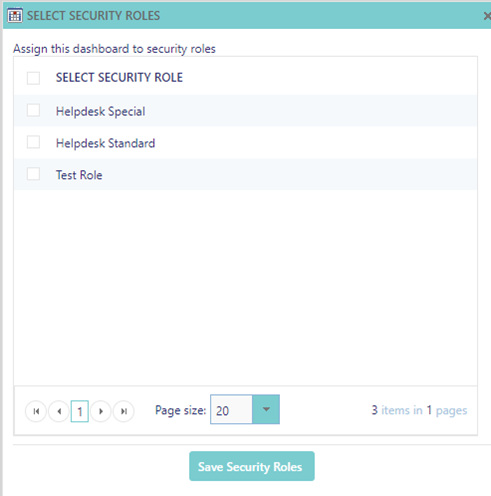
By default a dashboard is visible for all security roles in SoftwareCentral, but if the dashboard contains data that not all users that have the dashboard interface must see, the dashboard can be delegated to specific roles by clicking the “Add to security role” This will open a window with a list of all security roles in the system.
Set the check mark in the desired roles and press “Save Security Roles”.
When all setting is set as desired, press the “Save” button and the dashboard is now saved in the system and ready to use for other users.
To edit a dashboard, press on the dashboard name in the tab menu that need to be changed, and then press the edit button in the lower right corner. This will open the same menu as in the create dashboard.
To delete a dashboard, press on the dashboard name in the tab menu that need to be changed, and then press the delete button this will open a confirmation window, where after a confirmation the dashboard is deleted.