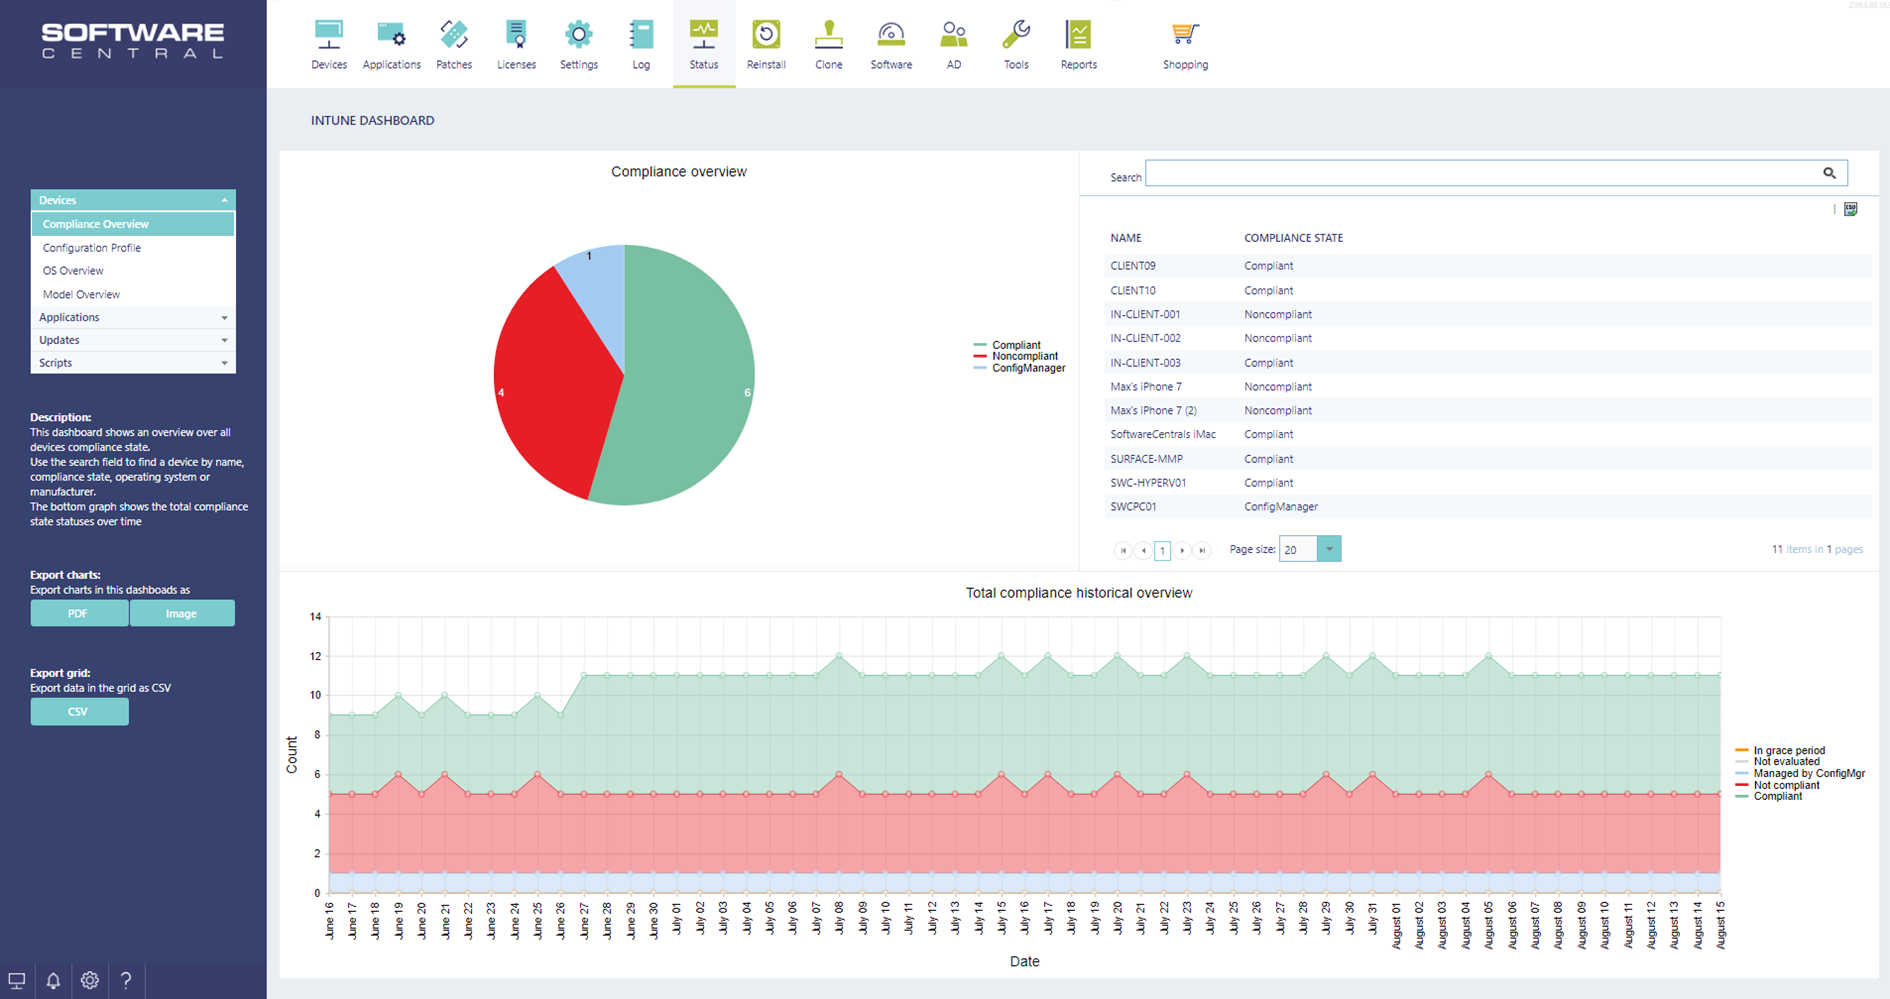
The interface is found under the Status button in SoftwareCentral and contains a range of different dashboards that show a graphical overview over different datasets from Intune.

Interface
In the left side of the interface there is a tab style menu where all the different dashboards are located, the dashboards are sorted into different categories, and is loaded when clicked.
Under this menu a smaller description of the dashboard is seen, and under this is the export buttons.
In the middle of the interface a grid with data and some graphs can been seen, all grids have a search bar above it where it possible to search for different items.
In the bottom of the left menu, it is possible to export the current graphs into PDF or PNG files and grid information’s into a CSV file.
The following list is a description of all the dashboards.
Devices
- Compliance Overview
This dashboard shows a pie chart of all devices Intune, and their compliance state.
In the grid it is possible to search for either for one or more specific devices, the different compliance state, the operating system, or the manufacture of the device. This search makes it possible to fast see a compliance representation of all devices from a specific manufacture.
The graph in the bottom shows the complete view of the compliance over time. This graph does not change when a search is made.
- Configuration Profile
This dashboard shows a list of all configuration profile in Intune, and when a one or more profile is selected, the pie chart will be populated with the combine data for these configuration profiles statuses.
The bottom graph shows the complete configuration profile status overview over time.
- OS Overview
This dashboard shows two pie charts of all devices Intune, and their operating system, and the version of these operating systems.
In the grid it is possible to search for either for one or more specific devices, the different compliance state, the operating system, or the manufacture of the device. This search makes it possible to fast search for a compliance state like non-compliant and see which operation systems that needs attention.
- Model Overview
This dashboard shows two pie charts of all devices Intune, and their manufacture and the model of these devices.
In the grid it is possible to search for either for one or more specific devices, the different compliance state, the operating system, or the manufacture of the device. This search makes it possible to fast search for a compliance state like non-compliant and see which manufactures devise that needs attention.
Applications
- Installation status
This dash shows a list of all applications in Intune and the installation count for each. It is possible to select one or more application in the grid, and then the two pie charts will be populated with the combine data of the selected. It will show status for both devices and users.
In the grid it is possible to search for either for one or more specific application, the publisher, or the platform of the application. This search makes it possible to fast an overview over the complete installation status situation of all applications of a specific publisher.
Updates
- iOS
This dashboard shows a list of all update policies for iOS devices. It is possible to select one or more policy in the grid and after selection, the two pie charts will be populated with the combined overview over statuses for both uses and devices.
- MacOS
This dashboard shows a list of all update policies for MacOS devices. It is possible to select one or more policy in the grid and after selection, the two pie charts will be populated with the combined overview over statuses for both uses and devices.
- Windows
This dashboard shows a list of all update policies for Windows devices. It is possible to select one or more policy in the grid and after selection, the two pie charts will be populated with the combined overview over statuses for both uses and devices.
Scripts
- Remediation
This dashboard shows a list of all remediation scripts in Intune. It is possible to select one or more script in the grid and after selection, the two pie charts will be populated with the combined overview over statuses for both uses and devices.
The bottom graph will show the combine historical overview for the selected scrips.
- Scripts
This dashboard shows a list of all scripts in Intune. It is possible to select one or more script in the grid and after selection, the two pie charts will be populated with the combined overview over statuses for both uses and devices.


