
If a deployment fails or takes too long time, in can be handy to access the log files from the client.
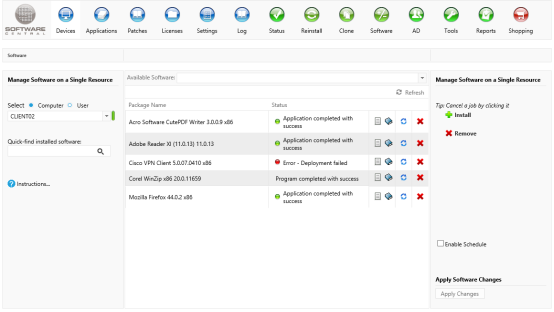
In the center grid, next to each program there are two log buttons.

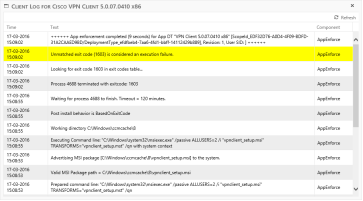
The icon formed as a single sheet will automatically look through the clients log files and find the most relevant log entries for the specific deployment.

When you click it, a new window will open. Analyzing log files can be time consuming and vary a lot from one application to another. In this window, only log messages relevant to the specific deployment are shown. Log messages are color coded, to easily identify any problems. In this example we can see that the deployment return an unmatched return code. Which in this case means that the deployment failed.
 For an ongoing deployment you can click on the “Refresh” button to refresh the log.

The client log icon will not always be available. If it isn’t there, then SoftwareCentral doesn’t know where to look. This can for instance be if the deployment was started outside of SoftwareCentral or was made by a Software Group or during an operating system deployment.
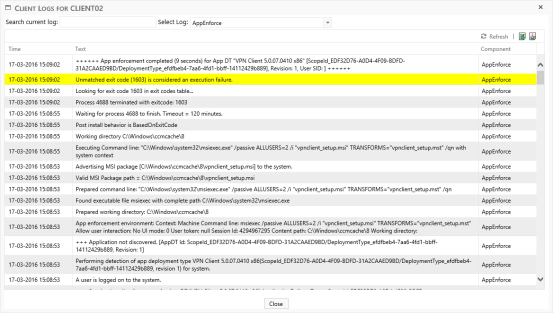
Next to the client log you will find a "multi-sheet" icon. This will open a new window from where you can browse all client logs.

SoftwareCentral will automatically show you the best log to start looking for errors in for the given package, application or Software Group.
The screenshot below shows the suggested log for an application deployment that failed.

In the top of the interface you can make a wildcard search in the currently selected log:
![]()
You can also select another log file:
![]()
You can also refresh the log and export it to either excel or pdf:
![]()